What does "Other" mean in Summary Reports?
The Summary Report pie chart visualizes the list's first-level breakdown. This chart only shows items that represent the majority of the tracked time (over 5% of the pie individually) — everything else is automatically put together into the Other slice.
The purpose of the "Other" segment is to prevent the cluttering of the pie chart. To "reveal" the data that's categorized as "Other" you can try selecting a shorter date range so that fewer segments would meet this criterion and would get their own individual segments.
Here's an example:
Project 1: 30 hours
Project 2: 20 hours
Project 3: 20 hours
Project 4: 20 hours
Project 5: 2 hours
Project 6: 5 hours
Project 7: 3 hours
In the Pie Chart, you will see: percentages for Projects 1, 2, 3, 4, and 6 individually, but then Project 5 and 7 will be grouped together as they makeup super small percentages of the chart, and adding them all individually would result in lots of small "pie" pieces you couldn't differentiate.
The screenshot below shows this as it would be in the webapp.
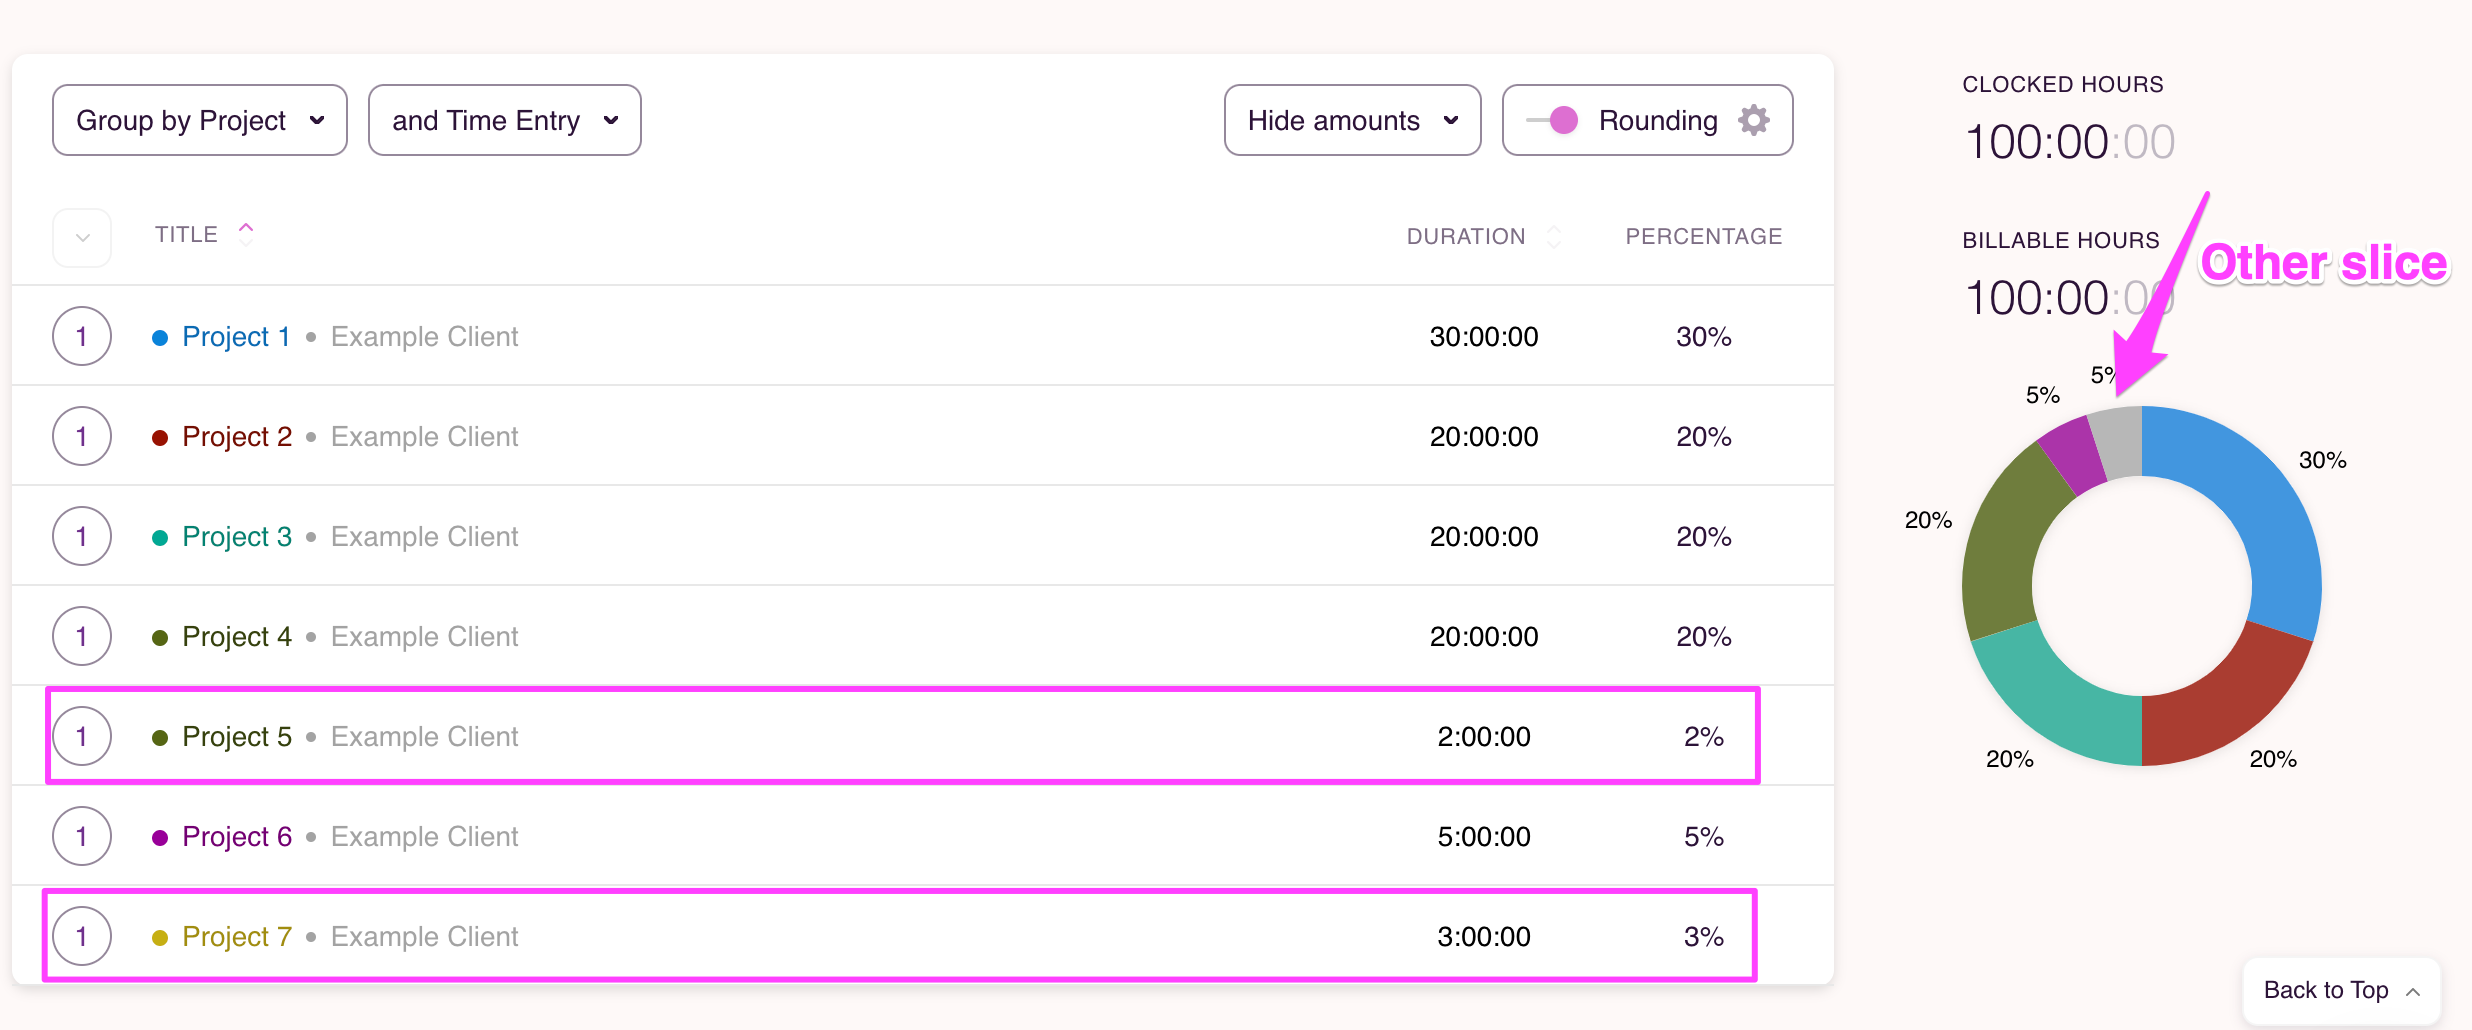
These "grouped" together projects make up the "other" slice on the pie chart.
Updated on: 06/16/2026
Thank you!